Error in Domain Controller monitoring as a result of missing NTDS performance counters
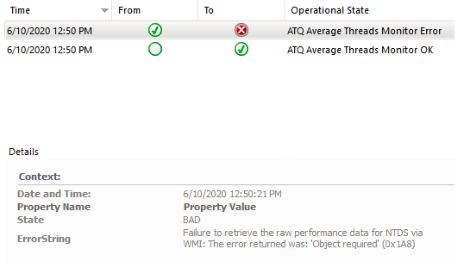
There are some Windows 2012R2 Domain Controllers shown continually as Critical. There is no evidence of instability or system error, but “ATQ Average Threads Monitor” holds error state. You can examine this monitor state with Health Explorer and find no value is returned. This monitor turns “red”, when measured value is above configured threshold or when error in monitoring occurred

This monitor uses a Visual Basic script (Atq_Thread_Usage.vbs) to check a value of performance counter. The same script return error value if performance counter value cannot be retrieved:

There is no reason to change script inside the monitor. It should be check if it is possible to obtain a value of this counter.
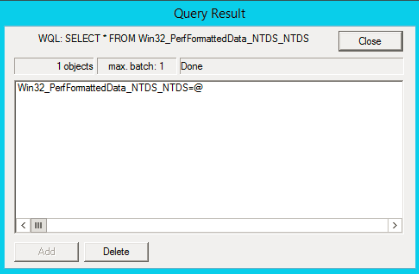
There is a WQL query inside the script, you can test with built-in tool: wbemtest.exe.
A healthy system gives a correct answer:

System considered as not-healthy gives an error of not-existent class instead.
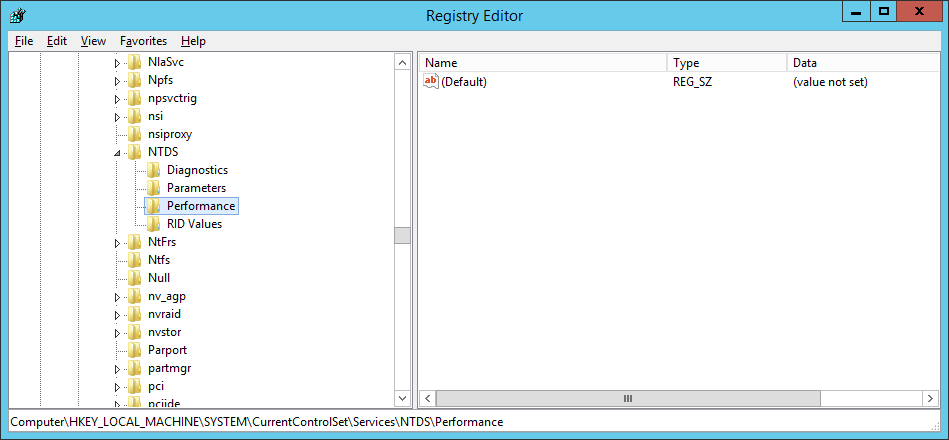
If no class found, no performance counter exists. A Performance key inside NTDS registry key is apparently empty:

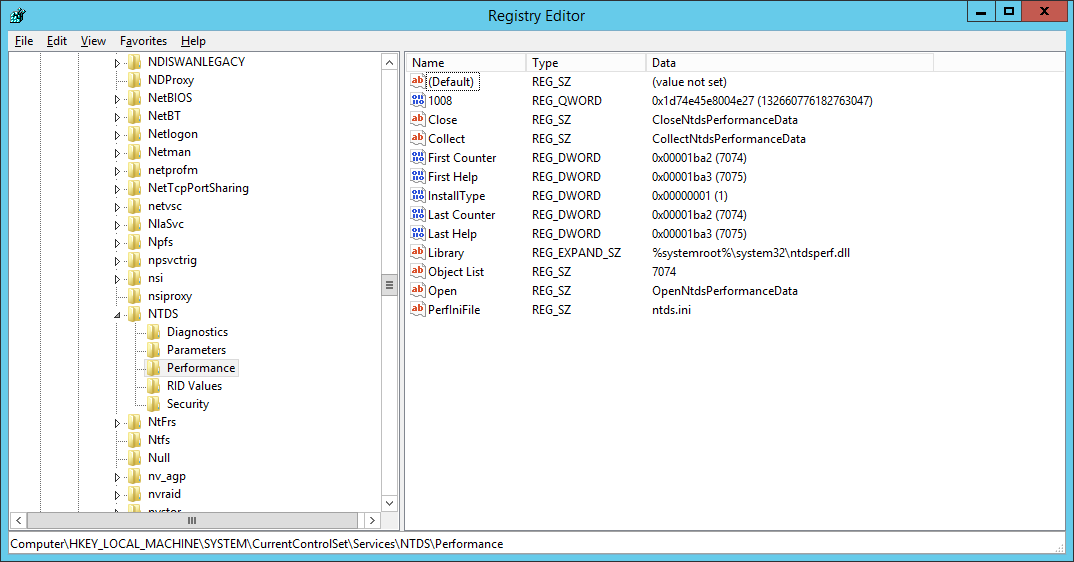
It should be noted, for healthy domain controller the same key is never empty:

The question is: how to repair it? It is not complicated, this the same case as described (Enabling NTDS Counters in Perfmon Monitoring) [1].
- Export the registry key from a healthy Windows 2012R2Domain Controller HKLM\SYSTEM\CurrentControlSet\Services\NTDS\Performance
into a REG file. - Exported file should be copied to a DC with performance counter error, and imported using regedit.
- A command line (as administrator) should be started
lodctr /R
No reason for system reboot exists. This command line is case sensitive (command switch must be “R”, not “r”). If the command ends with success, the registry key Performance is no longer empty. You can notice the value ObjectList is different from imported using REG file. Error in monitoring should disappear after some time (less than a quarter).
If you find the „ATQ Average Threads Monitor” turns red, it says that the threshold is exceeded.
In my opinion it should be another monitor placed in Configuration (not Performance) category to catch error in obtaining performance counter. Then you can easily differentiate error in monitoring from value exceeded the threshold error.
[1] https://theperformanceengineer.com/2014/02/01/enabling-ntds-counters-in-perfmon-monitoring/
 PL
PL